这篇“Python怎么实现天气预报系统”文章的知识点大部分人都不太理解,所以小编给大家总结了以下内容,内容详细,步骤清晰,具有一定的借鉴价值,希望大家阅读完这篇文章能有所收获,下面我们一起来看看这篇“Python怎么实现天气预报系统”文章吧。
1)运行环境
本文用到的环境如下——
Python3、Pycharm社区版,第三方模块:tkinter、bs4(BeautifulSoup)、pandas、
prettytable、matplotlib、re。部分自带的库只要安装完Python就可以直接使用了
一般安装:pip install +模块名
镜像源安装:pip install -i https://pypi.douban.com/simple/+模块名
#coding:utf-8
from tkinter import *
import re
from time import sleep
from urllib.request import urlopen
from bs4 import BeautifulSoup
import pandas
import prettytable
import matplotlib.pyplot as plt
from datetime import datetime
LOG_LINE_NUM = 0

class MY_GUI():
    def __init__(self,init_window_name):
        self.init_window_name = init_window_name

    #设置窗口
    def set_init_window(self):
        self.init_window_name.title("天气预报")           #窗口名
        self.init_window_name.geometry('1000x500+200+50')
        #标签
        self.init_data_label = Label(self.init_window_name, text="输入城市名")
        self.init_data_label.grid(row=0, column=0)
        self.result_data_label = Label(self.init_window_name, text="天气预测结果")
        self.result_data_label.grid(row=0, column=12)
        #文本框
        self.init_data_Text = Text(self.init_window_name, width=20, height=1)  #城市名录入框
        self.init_data_Text.grid(row=1, column=0, rowspan=2, columnspan=5)
        self.result_data_Text = Text(self.init_window_name, width=100, height=30)  #处理结果展示
        self.result_data_Text.grid(row=1, column=12, rowspan=10, columnspan=10)
        #按钮
        self.str_trans_to_md7_button = Button(self.init_window_name, text="获取天气情况", bg="lightblue", width=10,command=self.str_trans_to_md7)  # 调用内部方法  加()为直接调用
        self.str_trans_to_md7_button.grid(row=1, column=11)
        self.str_trans_to_img_button = Button(self.init_window_name, text="获取天气统计图", bg="lightblue", width=10,command=self.str_trans_to_img)  # 调用内部方法  加()为直接调用
        self.str_trans_to_img_button.grid(row=2, column=11)

    #功能函数
    def str_trans_to_md7(self):
        #储存天气情况的列表
        date,wea,tem_high,tem_low,wind_dire,wind_speed = [],[],[],[],[],[]
        #城市转ID
        city_id = pandas.read_excel('city_id.xlsx')
        dict_c = city_id.set_index('City_CN').T.to_dict('list')
        city = self.init_data_Text.get(1.0,END).strip()
        test_id = dict_c[city]
        test_id.append("".join(filter(str.isdigit, test_id[0])))
        print('城市ID:',test_id[1])
        #爬七日天气
        html_ID = "http://www.weather.com.cn/weather/"+test_id[1]+".shtml"
        html = urlopen(html_ID)
        soup = BeautifulSoup(html.read(),'html.parser')
        ag_links = soup.find_all("li", {"class": re.compile('sky skyid lv\\d')})
        for ag in ag_links:
            date.append(ag.h2.get_text())
            wea.append(ag.p.get_text())
            tem_high.append(ag.span.get_text())
            win = re.findall('(?<= title=").*?(?=")', str(ag.find('p','win').find('em'))) #正则问题的处理,摘自csdn
            wind_dire.append( '-'.join(win))
        for i in range(7):
            tem_low.append(soup.select('.tem i')[i].get_text())
            wind_speed.append(soup.select('.win i')[i].get_text())
        #输出图表
        table_ = prettytable.PrettyTable()
        table_.field_names = ['日期','天气', '最高温度','最低温度','风向','风力']
        for i in range(0,len(date)):
            table_.add_row([date[i], wea[i], tem_high[i],tem_low[i],wind_dire[i],wind_speed[i]])
        print(city,'七日天气')
        print(table_)
        weafile=open("近七日天气.txt","w+")
        weafile.write(city)
        weafile.write(test_id[1]+'/n')
        weafile.write(str(table_))
        weafile.close
        self.result_data_Text.delete(1.0,END)
        self.result_data_Text.insert(1.0,table_)
    def str_trans_to_img(self):#进行统计图的制作
        infopen = open('近七日天气.txt', 'r', encoding='gbk')
        outopen = open('out1.txt', 'w', encoding='gbk')
        lines = infopen.readlines()
        for line in lines:
            if line.split():
                outopen.writelines(line)
            else:
                outopen.writelines("")
        infopen.close()
        outopen.close()
        with open("out1.txt", encoding='gbk') as fp_in:
            with open('out.txt', 'w', encoding='gbk') as fp_out:
                fp_out.writelines(line for i, line in enumerate(fp_in) if i > 2 and i<10)
        # clearnumber
        file = open("out.txt", "r")  # 以只读模式读取文件
        something=file.readlines()
        new=[]
        for x in something:
            first = x.strip('\\n')
            second=first.split()
            while '|' in second:
                second.remove('|')
            new.append(second)

        dates, highs, lows = [], [], []
        for day in range(7):
            highs.append(int(new[day][2]))
            lows.append(int(new[day][3][0:2]))
            dates.append(new[day][0])

        fig = plt.figure(dpi=128, figsize=(10, 6))
        plt.plot(dates, highs, c='red', alpha=0.5) # alpha指定颜色透明度
        plt.plot(dates, lows, c='blue', alpha=0.5) # 注意dates和highs 以及lows是匹配对应的
        plt.fill_between(dates, highs, lows, facecolor='blue', alpha=0.1) # facecolor指定了区域的颜色
        # 设置图形格式
        plt.rcParams['font.sans-serif']=['SimHei'] #显示中文标签
        plt.rcParams['axes.unicode_minus']=False
        plt.title("近七日温度", fontsize=24)
        plt.xlabel('', fontsize=14)
        fig.autofmt_xdate() # 让x轴标签斜着打印避免拥挤
        plt.ylabel('Temperature(℃)', fontsize=14)
        plt.tick_params(axis='both', which='major', labelsize=14)
        plt.savefig('温度折线图.jpg')
        plt.show()


        dic_wea = {}
        for i in range(0, 7):
            if new[i][1] in dic_wea.keys():
                dic_wea[new[i][1]] += 1
            else:
                dic_wea[new[i][1]] = 1
        plt.rcParams['font.sans-serif'] = ['SimHei']
        print(dic_wea)
        explode = [0.01] * len(dic_wea.keys())
        color = ['lightskyblue', 'silver', 'yellow', 'salmon', 'grey', 'lime', 'gold', 'red', 'green', 'pink']
        plt.pie(dic_wea.values(), explode=explode, labels=dic_wea.keys(), autopct='%1.1f%%', colors=color)
        plt.title('未来7天气候分布饼图')
        plt.savefig('气候饼图.jpg')
        plt.show()


def gui_start():
    init_window = Tk()              #实例化出一个父窗口

    ZMJ_PORTAL = MY_GUI(init_window)

    ZMJ_PORTAL.set_init_window()    # 设置根窗口默认属性

    init_window.mainloop()          #父窗口进入事件循环,可以理解为保持窗口运行,否则界面不展示

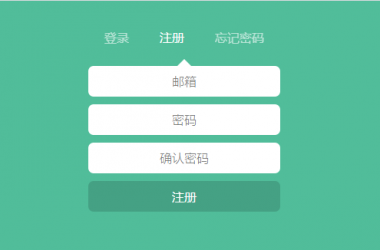
gui_start()1)天气预报系统

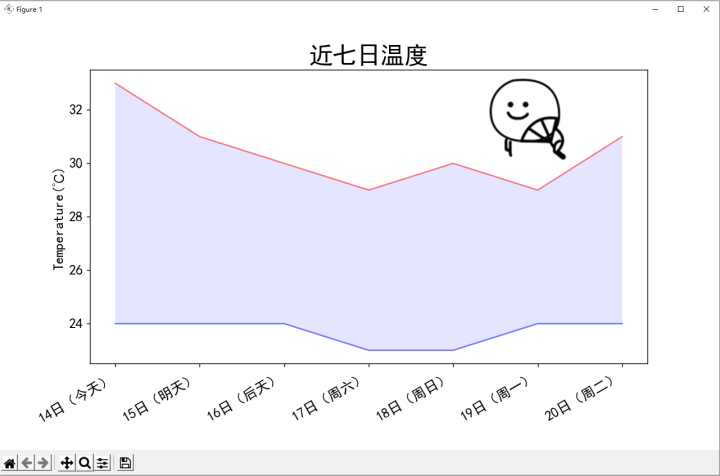
2)温度折线图
3)气温饼图

以上就是关于“Python怎么实现天气预报系统”这篇文章的内容,相信大家都有了一定的了解,希望小编分享的内容对大家有帮助,若想了解更多相关的知识内容,请关注捷杰建站行业资讯频道。
本站采用系统自动发货方式,付款后即出现下载入口,如有疑问请咨询在线客服!
售后时间:早10点 - 晚11:30点
 服务热线 19970861797

 返回顶部
返回顶部